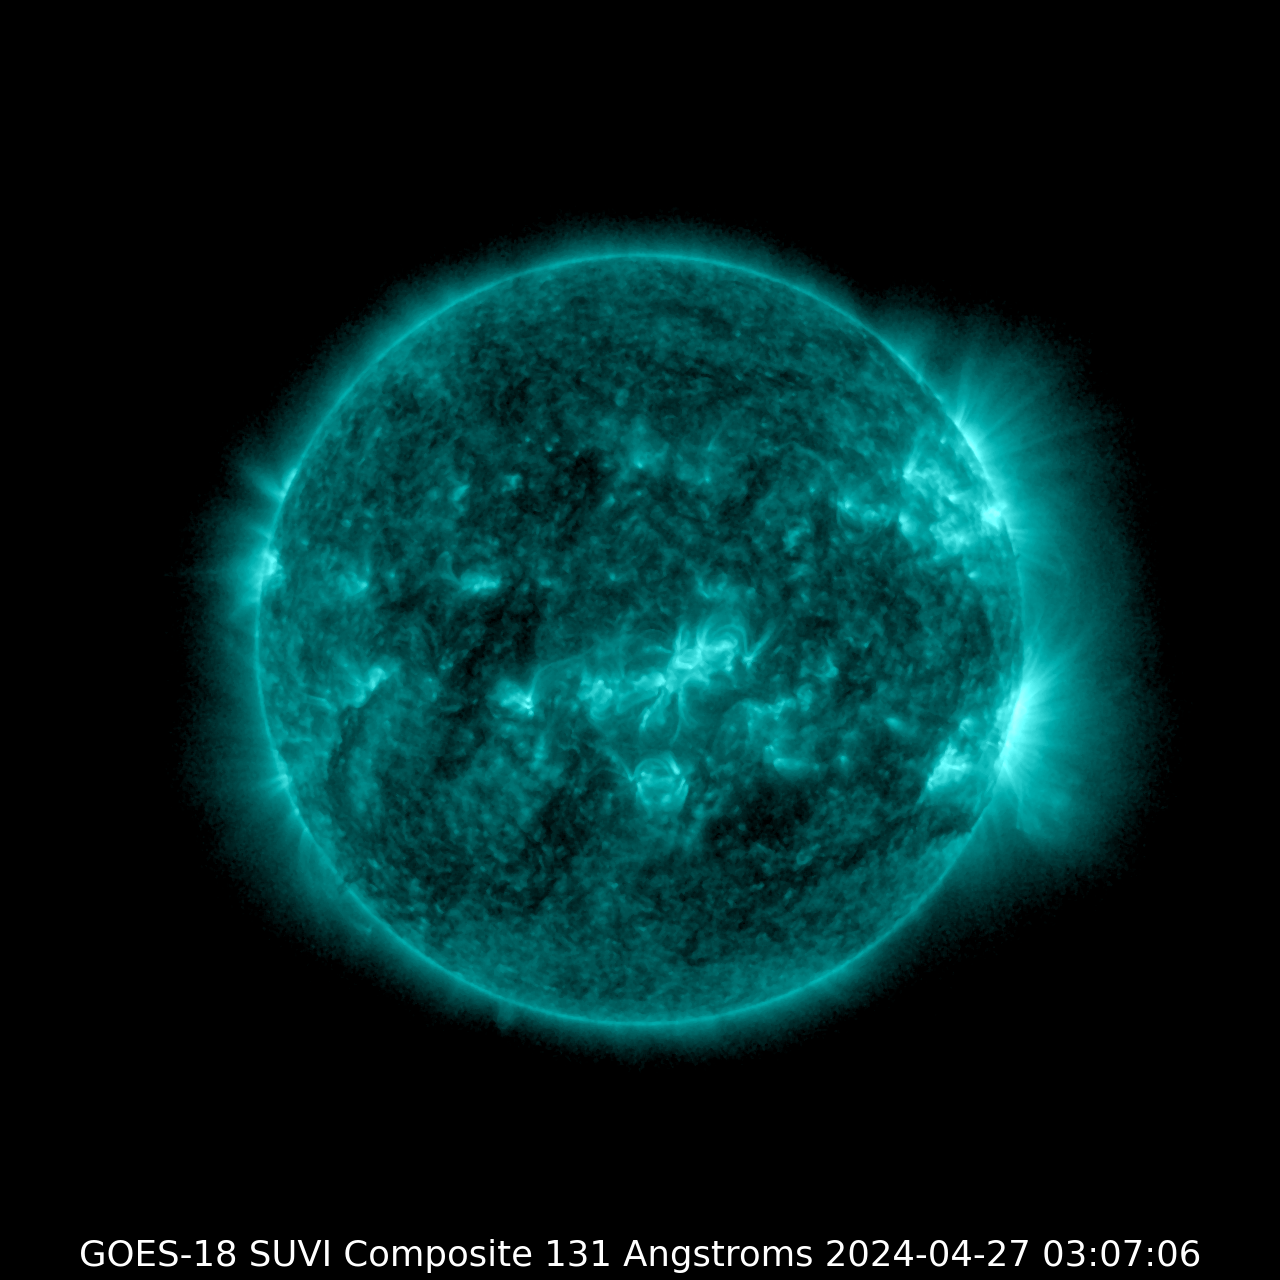
131A quicklook
131Tracks hot flare plasma and active-region structure.
NOAA SWPC GOES SUVIquicklook
Observed: Jul 15, 7:57 PM UTCFetched: Jul 15, 7:58 PM UTC
View upstream sourceMonitor the Sun with live solar imagery, radio blackout guidance, and short-range solar flare forecast data from NOAA SWPC. This page helps you track active regions, D-region absorption, and flare probabilities that can shape wider space weather conditions.
Tracks hot flare plasma and active-region structure.
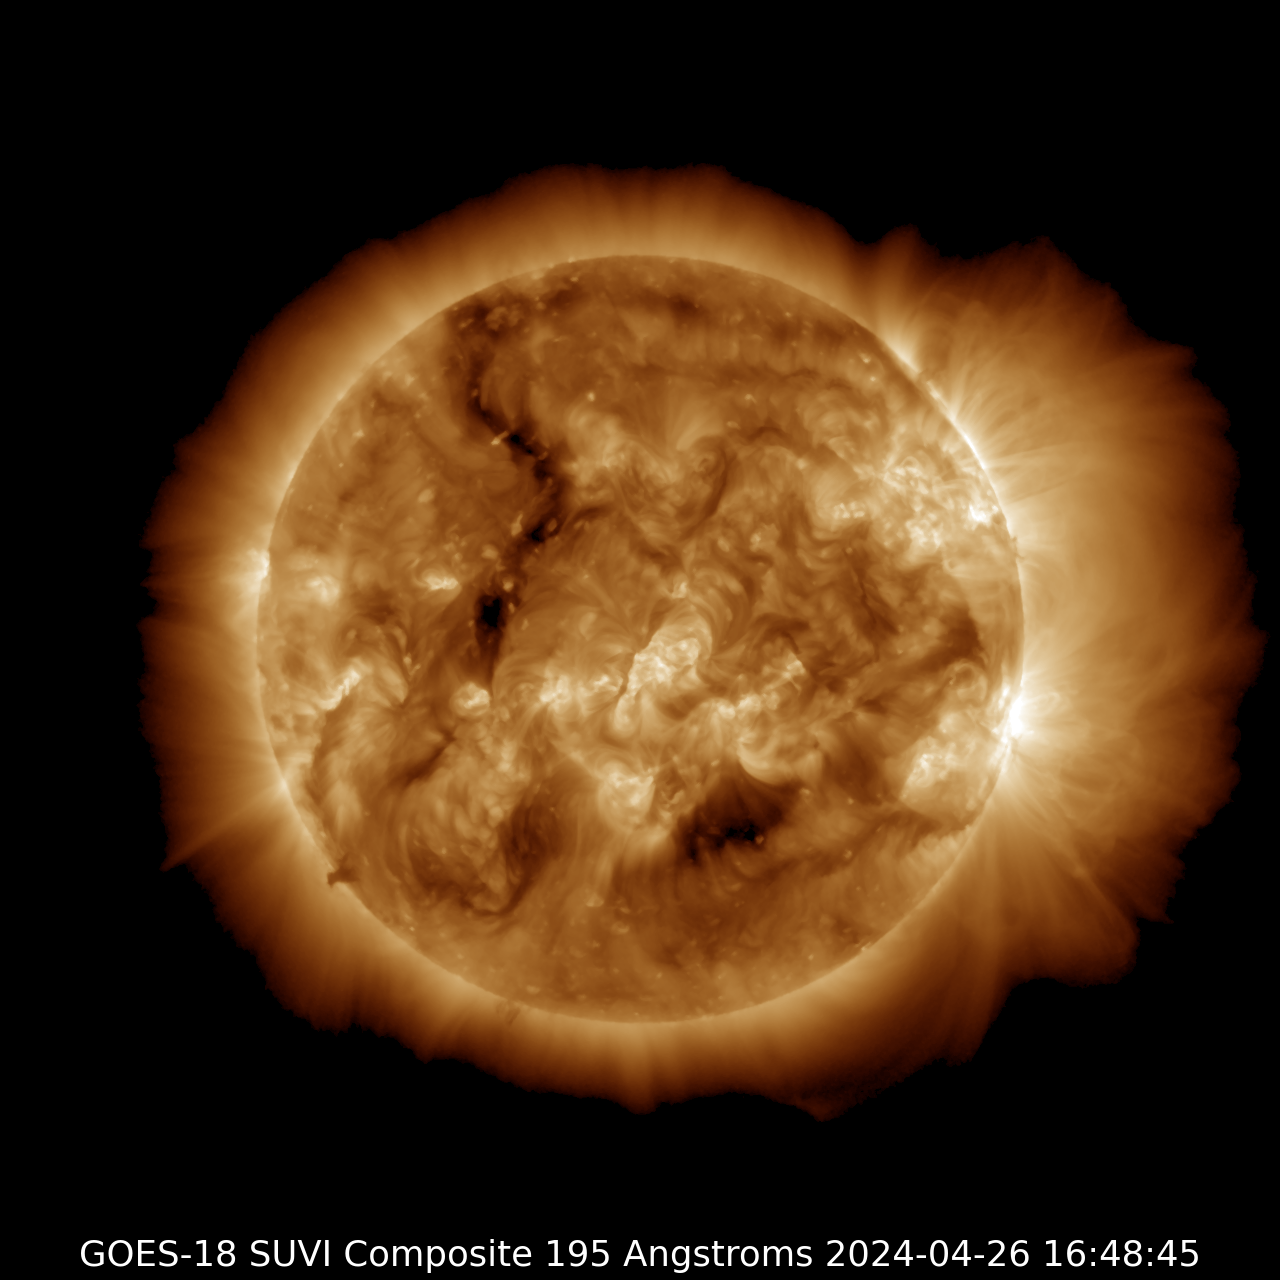
Highlights coronal loops and expanding structures around active regions.
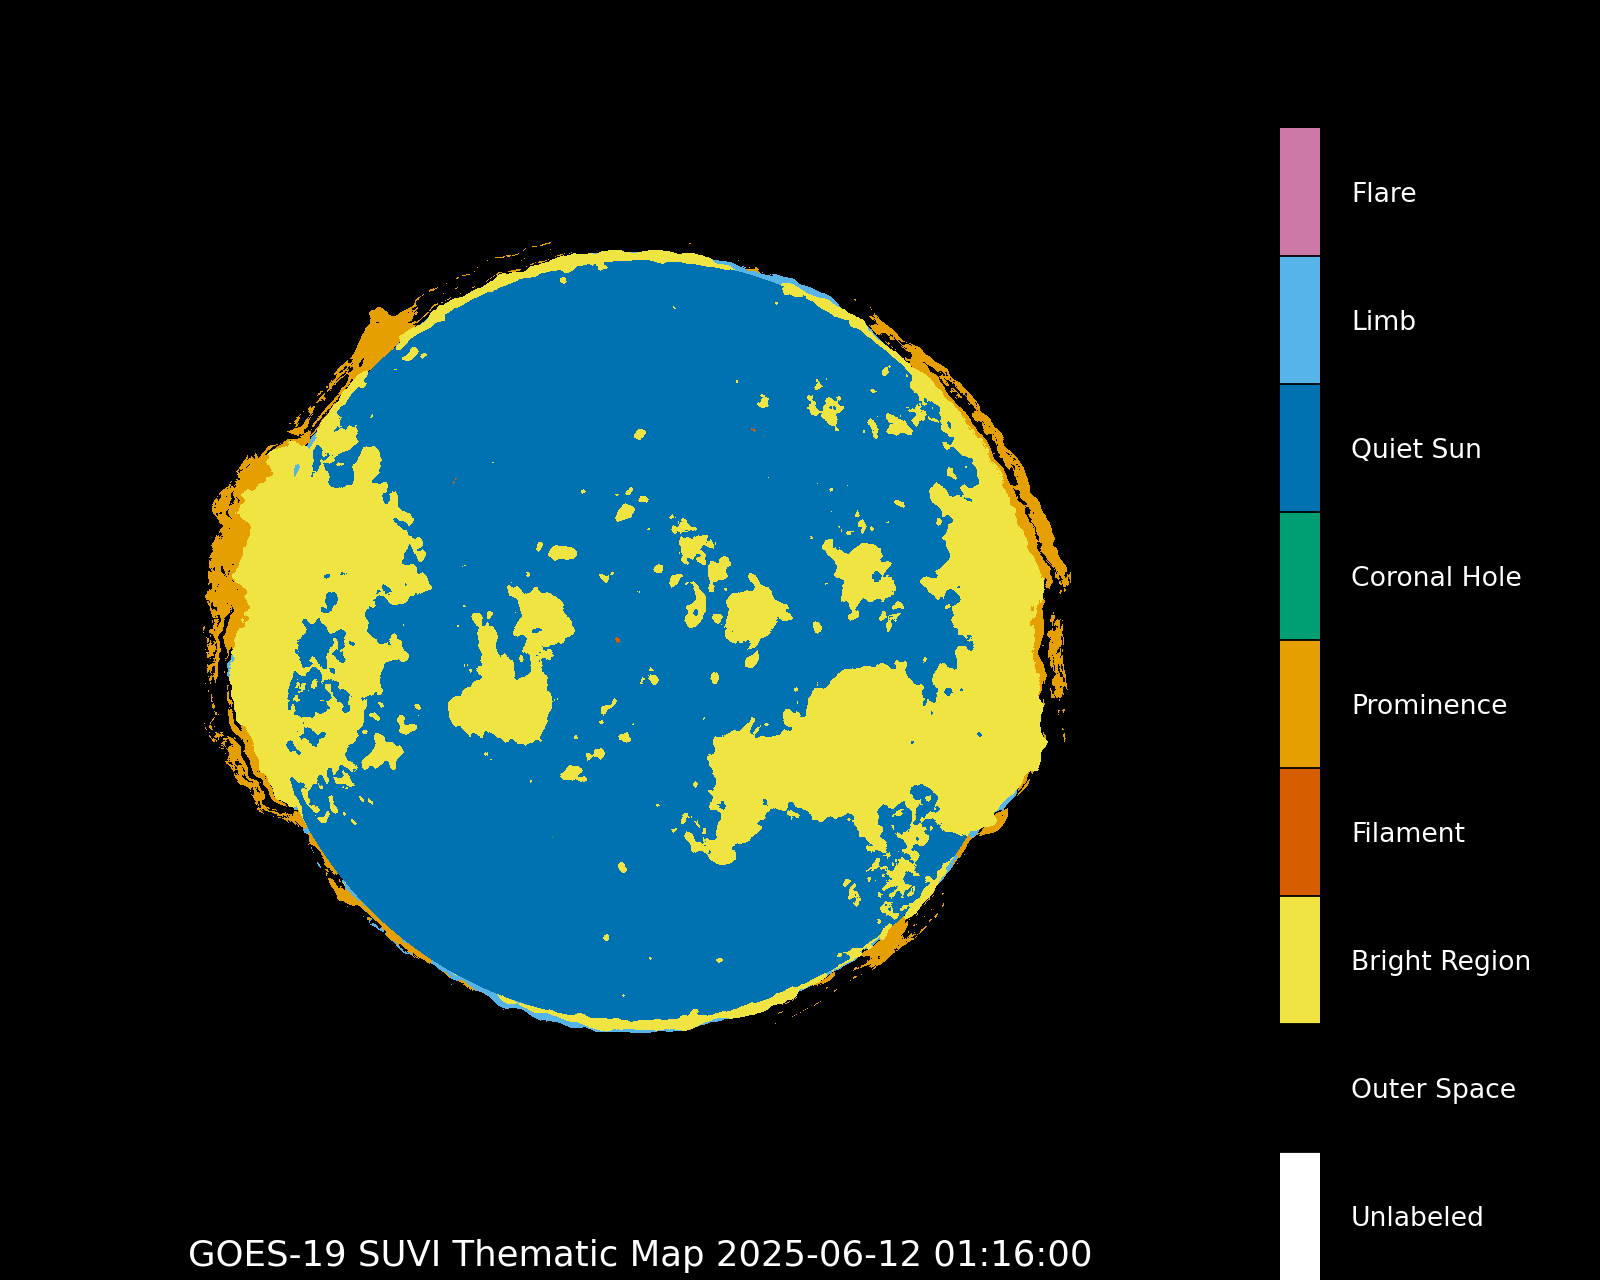
SWPC thematic map view for broad solar context and morphology tracking.

Normal X-ray Background and Normal Proton Background.
Estimated recovery: No Estimate
X-ray: Normal X-ray Background
Proton: Normal Proton Background
NO NEW X-RAY FLUX FOR 2 MINUTES
Next day: 55% C, 10% M, 1% X, 1% proton.
2026-07-15
2026-07-16
2026-07-17
GOES SUVIimages are “quicklook” products — the latest available frame from the satellite, not a processed archive. Each wavelength channel shows different temperatures: 131Å highlights hot flare plasma (~10 million K), while 195Å reveals coronal loops and structures (~1.5 million K).
D-RAP is an operational product showing current radio absorption conditions. During a solar flare, increased X-ray flux ionizes the D-layer of the ionosphere, absorbing HF (3–30 MHz) radio waves passing through it.
Flare forecast probabilities are from the latest SWPC issuance, projected across three days. C-class flares are common and minor; M-class can cause brief radio blackouts; X-class are rare and can cause planet-wide disruptions.
Snapshot generated: Jul 15, 7:58 PM UTC